SMU Office of Research – Even before the big data deluge, economists already had access to oceans of economic data, but the sheer volume and complexity drove economists to form assumptions that might fail to get the true story out of the data.
Thanks to advances in econometrics, which use statistics to test the reality of economic models, economists are gradually getting a clearer picture of how the economy works.
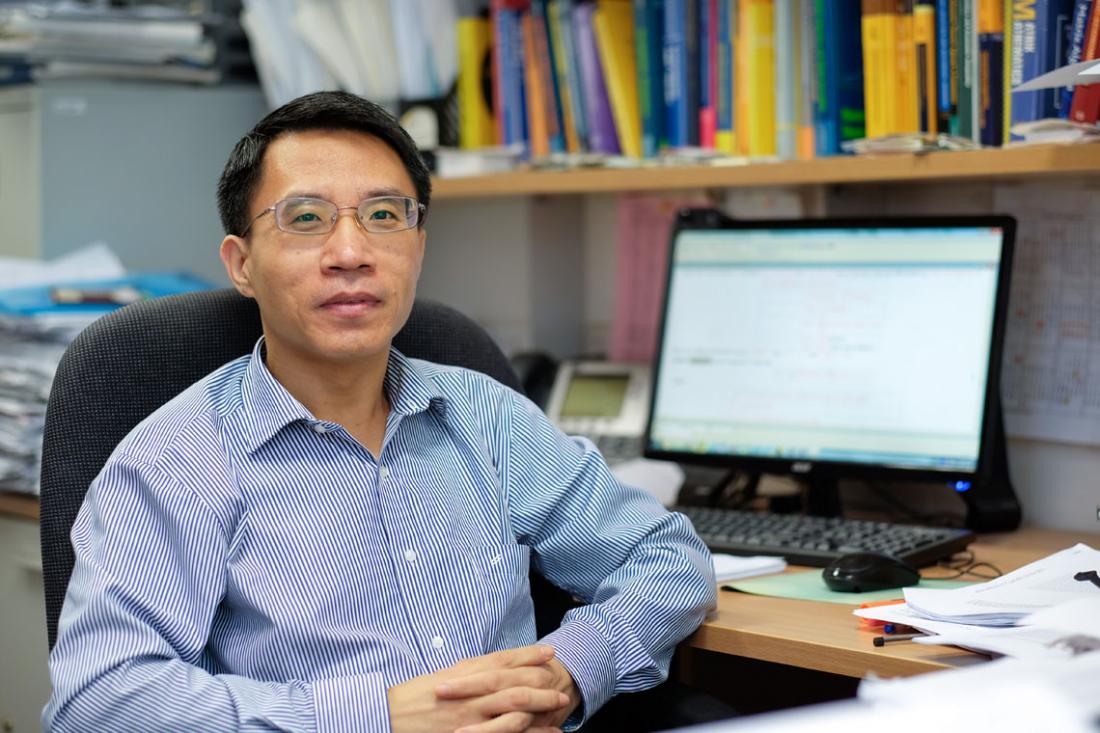
Working at the forefront of these advancements is Professor Su Liangjun from the Singapore Management University (SMU) School of Economics. He endeavours to remove as many assumptions as possible from econometric models so that they produce a more realistic explanation of the economy.
Letting the data speak freely
“The problem is that we cannot analyse the full complexity of economics and human behaviour all at once, so we simplify the behaviour to fit it into models,” says Professor Su.
Similar to economists’ infamous assumptions that humans are always rational and utility-seeking, econometricians also assume that relationships between data are simpler than in real life. Econometric models often assume that data is normally distributed, or that two variables have a linear relationship. These assumptions mask the real story about why an economy is behaving in a certain way, such as why it has a high savings rate or is experiencing growth.
Professor Su has developed innovative ways to unpick these assumptions and “allow the data to speak”, in particular by enabling more sophisticated analyses of panel data.
Panel data is a collection of multiple observations over time about people, companies or other economic agents, in relation to economic variables such as interest rates, savings rates and foreign investment, to name but a few. Analysing panel data to establish cause and effect is challenging because the variables are influenced not only by each other but also factors outside of the data. Moreover, forming panel structures involves sorting hundreds or even thousands of individual economic agents into the right groups according to their common parameters. These challenges result in econometricians having to resort to making assumptions.
“Traditionally, econometricians assume that relationships among economic variables in panel data are homogeneous, i.e., they remain the same in any context,” Professor Su explains. “For example, they assume that democracy affects economic growth in the same way across all countries over a long historical period. This assumption allows them to run a linear model of economic growth rate on a democracy variable with some other control variable by assuming the slope in the linear model is the same across countries.”
The major challenge, Professor Su notes, is to confront econometric models directly with economic data by removing as many restrictive assumptions as possible. Such a model will be flexible enough to capture the reality and yield results that can be interpreted in meaningful ways, he says.
Not everything is the same, but not everything is different either
While Professor Su wishes to challenge assumptions of homogeneity in these relationships, he points out that it is just as difficult to assume the opposite. If one assumes that the effects are different in every country, the data becomes too sparse and disparate to analyse.
To solve this dilemma, Professor Su proposed a middle ground for grouping economic agents (such as countries) according to what the data says, rather than based on arbitrary groupings like geographical regions. The challenge is how to determine these groups in the first place.
Professor Su made this key breakthrough in a surprising place. He recounts how he had visited fellow econometricians in the University of Colorado Boulder in the United States to learn about the statistical tool, Least Absolute Shrinkage And Selection Operator (LASSO). At the airport on his way home, he had a brainwave that LASSO could help him structure panel data sets because it was also designed to help find patterns in disparate data.
This opened up a whole new perspective, particularly with regard to economic regions, says Professor Su. In a 2013 study published in Econometric Theory, he found that even among a small group of OECD (Organisation for Economic Co-operation and Development) countries, there were differences in how physical capital, human capital and labour force growth affected the economy.
And in a 2014 study with peers at Yale University, Professor Su and his colleagues studied a sample of 57 countries according to how the savings rate was influenced by inflation rate, real interest rate and per capita GDP. The study showed that unlike the common assumption at that time, not all Asian countries were good savers compared to European countries.
Studying economic relationships over time
It is not only geographical boundaries that Professor Su and his fellow econometricians are breaking down but also boundaries of time, which is especially important given the profound changes in economies across the world.
“My view is that economic relationships always depend on the landscape they are operating in. Due to changes in preference, technological progress, or policy interventions, economic relationships may change over time. My colleagues and I developed some econometric methodologies to identify potential structural changes among economic relationships and applied it to economic data,” he shares.
In a recent collaboration with a colleague from Shanghai Jiao Tong University, Professor Su found that Foreign Direct Investment (FDI) affects economic growth differently over time. He found that before the 1997 Asian financial crisis, the relationship between FDI and economic growth fell significantly compared to before the crisis.
Prof Su has high hopes for the future of econometrics. The liberation of economic models from blurring assumptions combined with new technology and the emergence of big data could turn econometrics into a powerful economic tool.
“The availability of more and more large dimensional data sets, or big data, will help us develop new statistical and econometric techniques, leading to more meaningful research in large dimensional panel data that can be used by applied researchers.”
By David Turner


