
A*STAR researchers have created a program that predicts public transport usage based on land-use and the location of amenities, an essential capability for smart city planning.
From schools and shops to hospitals and hotels, a modern city is made of many different parts. Urban planners must take account of where these services are located when designing efficient transit networks. Singapore's Agency for Science, Technology and Research (A*STAR) researchers have developed a machine-learning program to accurately recreate and predict public transport use, or ‘ridership’, based on the distribution of land-use and amenities in Singapore [1].
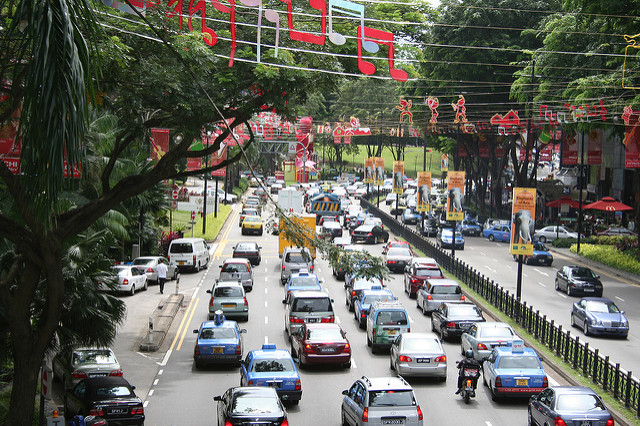
Traditional cities comprise an inner central business district (CBD), where most people work, surrounded by outer residential and industrial zones. Unfortunately for commuters, the high volume of people traveling to and from the CBD can cause gridlock at peak hours. To alleviate some of this frustration, the Singaporean government is working on creating regional centers by the year 2030. The planners hope to encourage business owners to open at specified regional centers around the city-state, easing peak-time pressure and encouraging public transport use.
“We’re aiming to understand the recipe for a smart city,” explains Christopher Monterola at the A*STAR Institute of High Performance Computing, who led the project in collaboration with scientists across Singapore. “Singapore needs an efficient transport system to support people’s activities given the existing and planned infrastructure. To guide planners, we needed a model that could predict ridership under the regional centers plan.”
The team collected data from the city’s smartcard system on people tapping in and out of individual bus and subway stations over a period of a week — more than 20 million journeys in total.
The smartcard data was combined with city-wide information on how land was being used — for business, industry, residence, water or greenery — and high-resolution maps that identified individual amenities within a set radius of each station. Monterola’s team trialed three different machine-learning models — computer programs that train themselves through repeated simulations — to find one that first accurately reproduced, and then predicted, transport ridership across the city.
“We found that a decision tree model performed best, with good accuracy, computational efficiency and an easy-to-follow user display,” says Monterola. “Results indicated that an increase in amenities of up to 55 per cent across the city would increase ridership. Beyond this point, ridership begins to decline; this is logical because if amenities are available locally, people walk instead.”
The high-resolution amenity data proved a much stronger predictor of ridership than general land-use details; a useful result for informing future urban planning and monitoring Singapore’s regional centers as they develop. The model could be applied to any city with access to similar high-resolution data, notes Monterola.
The A*STAR-affiliated researchers contributing to this research are from the Institute of High Performance Computing. For more information about the team’s research, please visit the Complex Systems Group webpage.
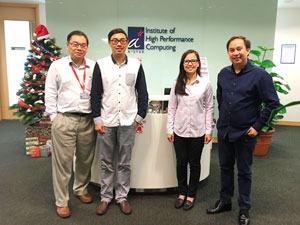
From left: Gary Lee, Hu Nan, Erika Fille Legara, and Christopher Monterola.
© 2017 A*STAR Institute of High Performance Computing