


Climate models contain biases that can affect the reliability of future climate projections. We investigated how sea surface temperature (SST) biases affect the North Pacific westerly jet. In 34 of 35 climate models, the jet was located farther south when SSTs were simulated rather than prescribed from observations. Additional experiments showed that SST biases, particularly in the northwestern Pacific, play an important role in this southward shift.
【Sea Surface Temperature Biases in Climate Models】
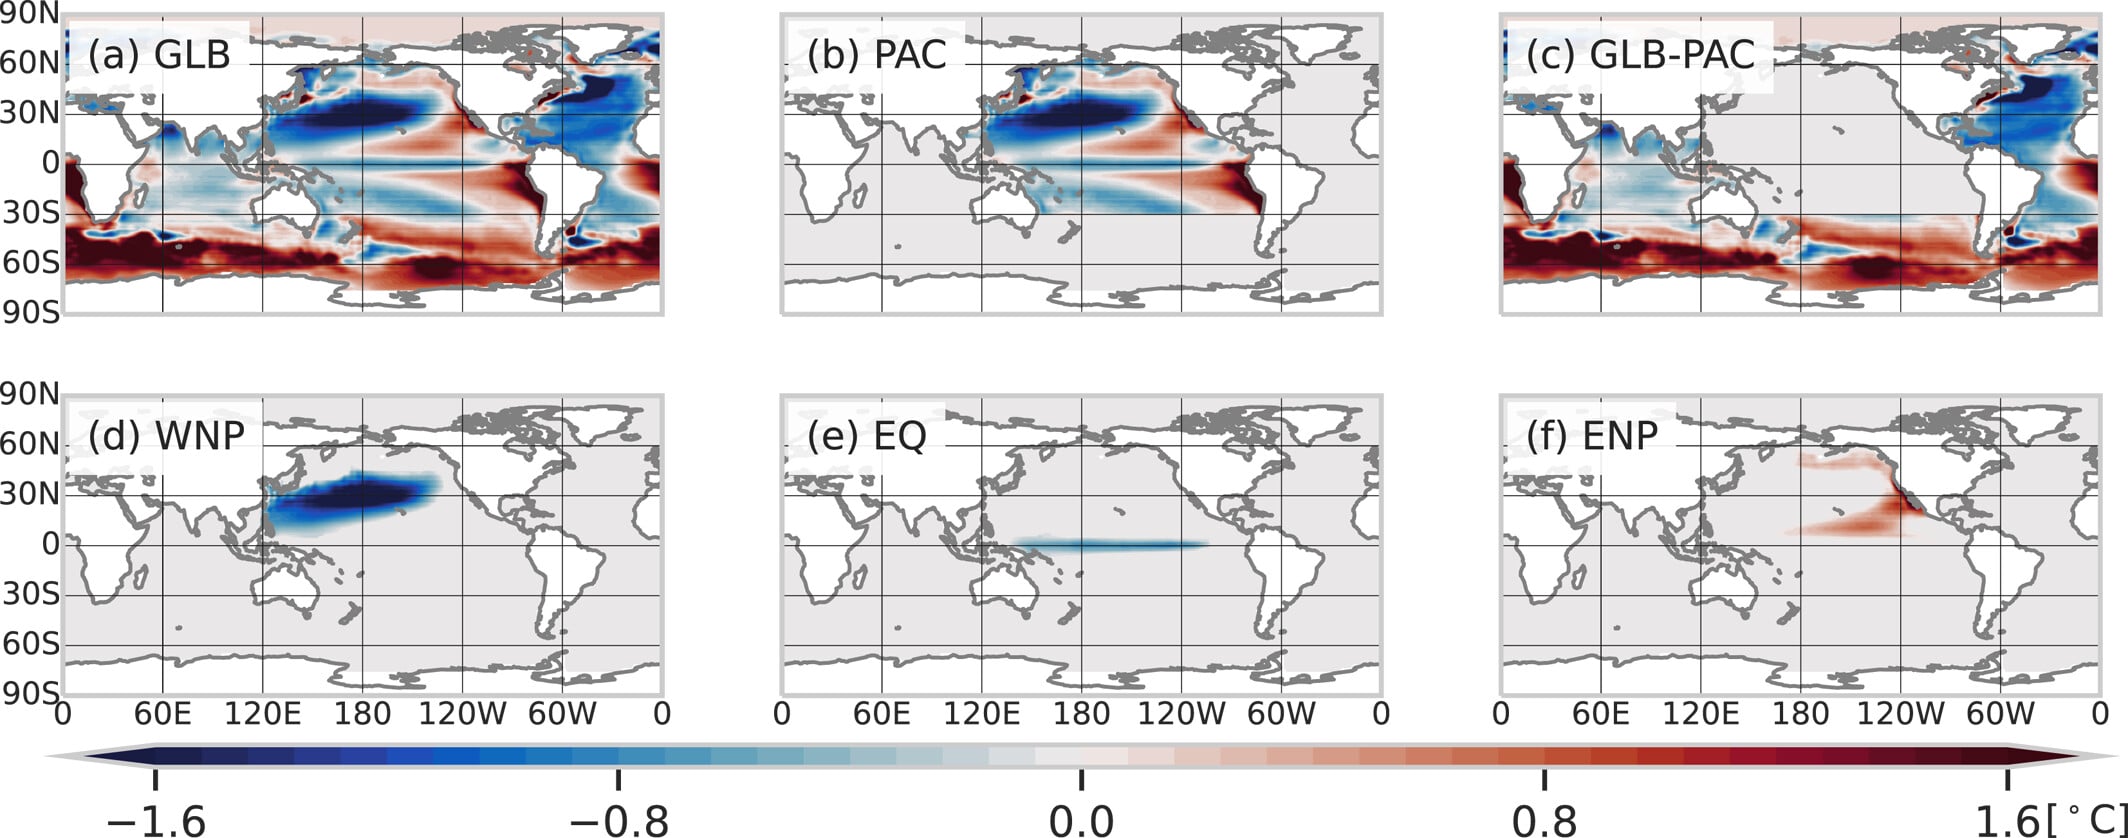
Annual-mean sea surface temperature (SST) biases in climate models for 1985–2014 and their regional components. Blue indicates SSTs lower than observations, while red indicates SSTs higher than observations.
Yusuke Ushijima (Ehime University)
【Westerly Jet Biases and the Effects of Sea Surface Temperature Biases】
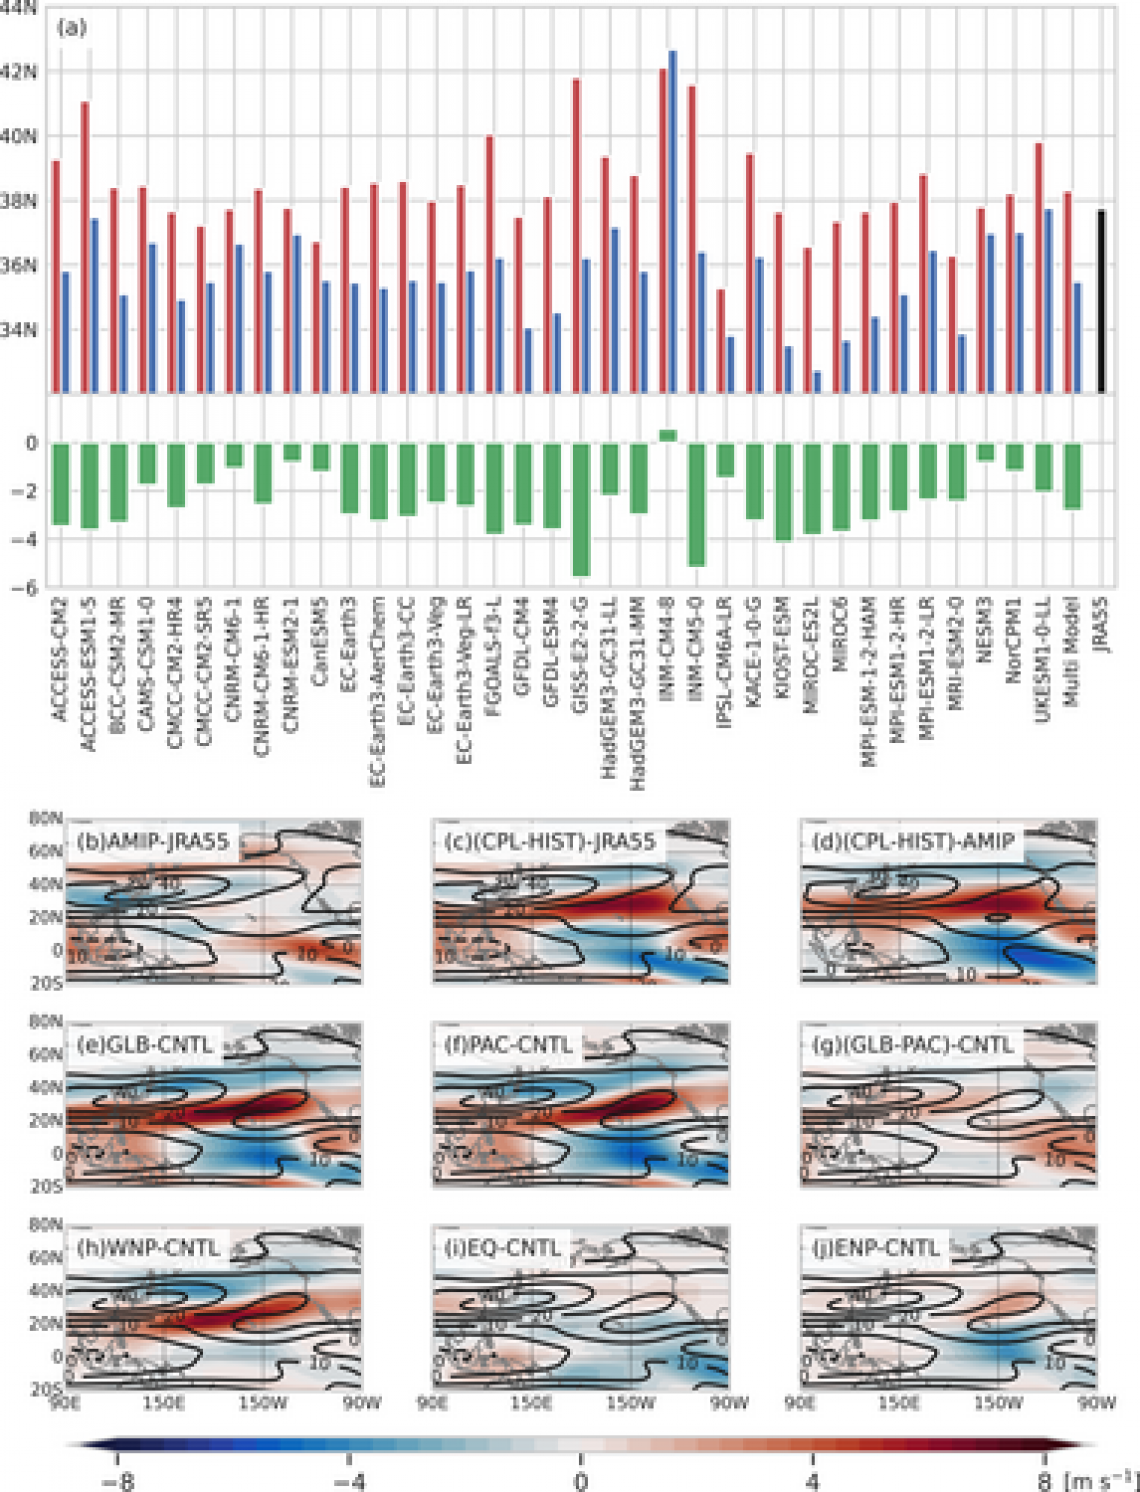
(a) The upper panel compares the latitude of the North Pacific westerly jet when observed SSTs are prescribed (red) and when SSTs are simulated by climate models (blue). Black indicates the jet latitude based on observational data. The green bars in the lower panel show the differences between the two simulations; in 34 of 35 models, the jet is located farther south when SSTs are simulated by climate models. (b–d) Biases in the westerly jet and differences between the two simulations. (e–j) Changes in the westerly jet in experiments with the SST biases shown in Figure 1. In particular, the northwestern Pacific SST bias (h) reproduces the southward shift of the jet.
Yusuke Ushijima (Ehime University)
Climate models are numerical models used to project future climate change. They simulate the climate from the present to the future by calculating changes in the atmosphere, ocean, and other components of the climate system. However, simulations of the present-day climate do not perfectly reproduce observations and contain various biases. The model characteristics that cause these biases can also affect simulations of the future climate. Understanding the causes and impacts of present-day climate biases is therefore important for improving the reliability of future climate projections.
In this study, we focused on the North Pacific westerly jet, a band of strong winds blowing from west to east in the upper atmosphere at midlatitudes, and investigated how biases in its position are affected by sea surface temperature (SST). The Coupled Model Intercomparison Project Phase 6 (CMIP6), an international climate model comparison project involving research institutions around the world, includes simulations that model both the atmosphere and ocean, as well as atmospheric simulations driven by observed SSTs. Comparing these simulations, we found that in 34 of 35 models, the westerly jet was located farther south when SSTs were simulated by the climate models than when observed SSTs were prescribed.
We then conducted additional atmospheric model experiments to investigate the effects of SST biases on the westerly jet in more detail. When SST biases found in climate models were added to observed SSTs, the experiments reproduced the southward shift of the jet. Experiments in which SST biases were imposed separately in different regions further showed that biases in the northwestern Pacific play a particularly important role in shifting the westerly jet southward.
The westerly jet is closely related to weather and climate in East Asia, including Japan. Our results show that SST biases play an important role in biases in the position of the North Pacific westerly jet. Improving the representation of SST in climate models could therefore lead to a more accurate representation of atmospheric circulation affecting Japan and East Asia and contribute to improving the reliability of future climate projections.
Advertisement