



A new computational method aligns spatial transcriptomics data while retaining cell-level measurements.
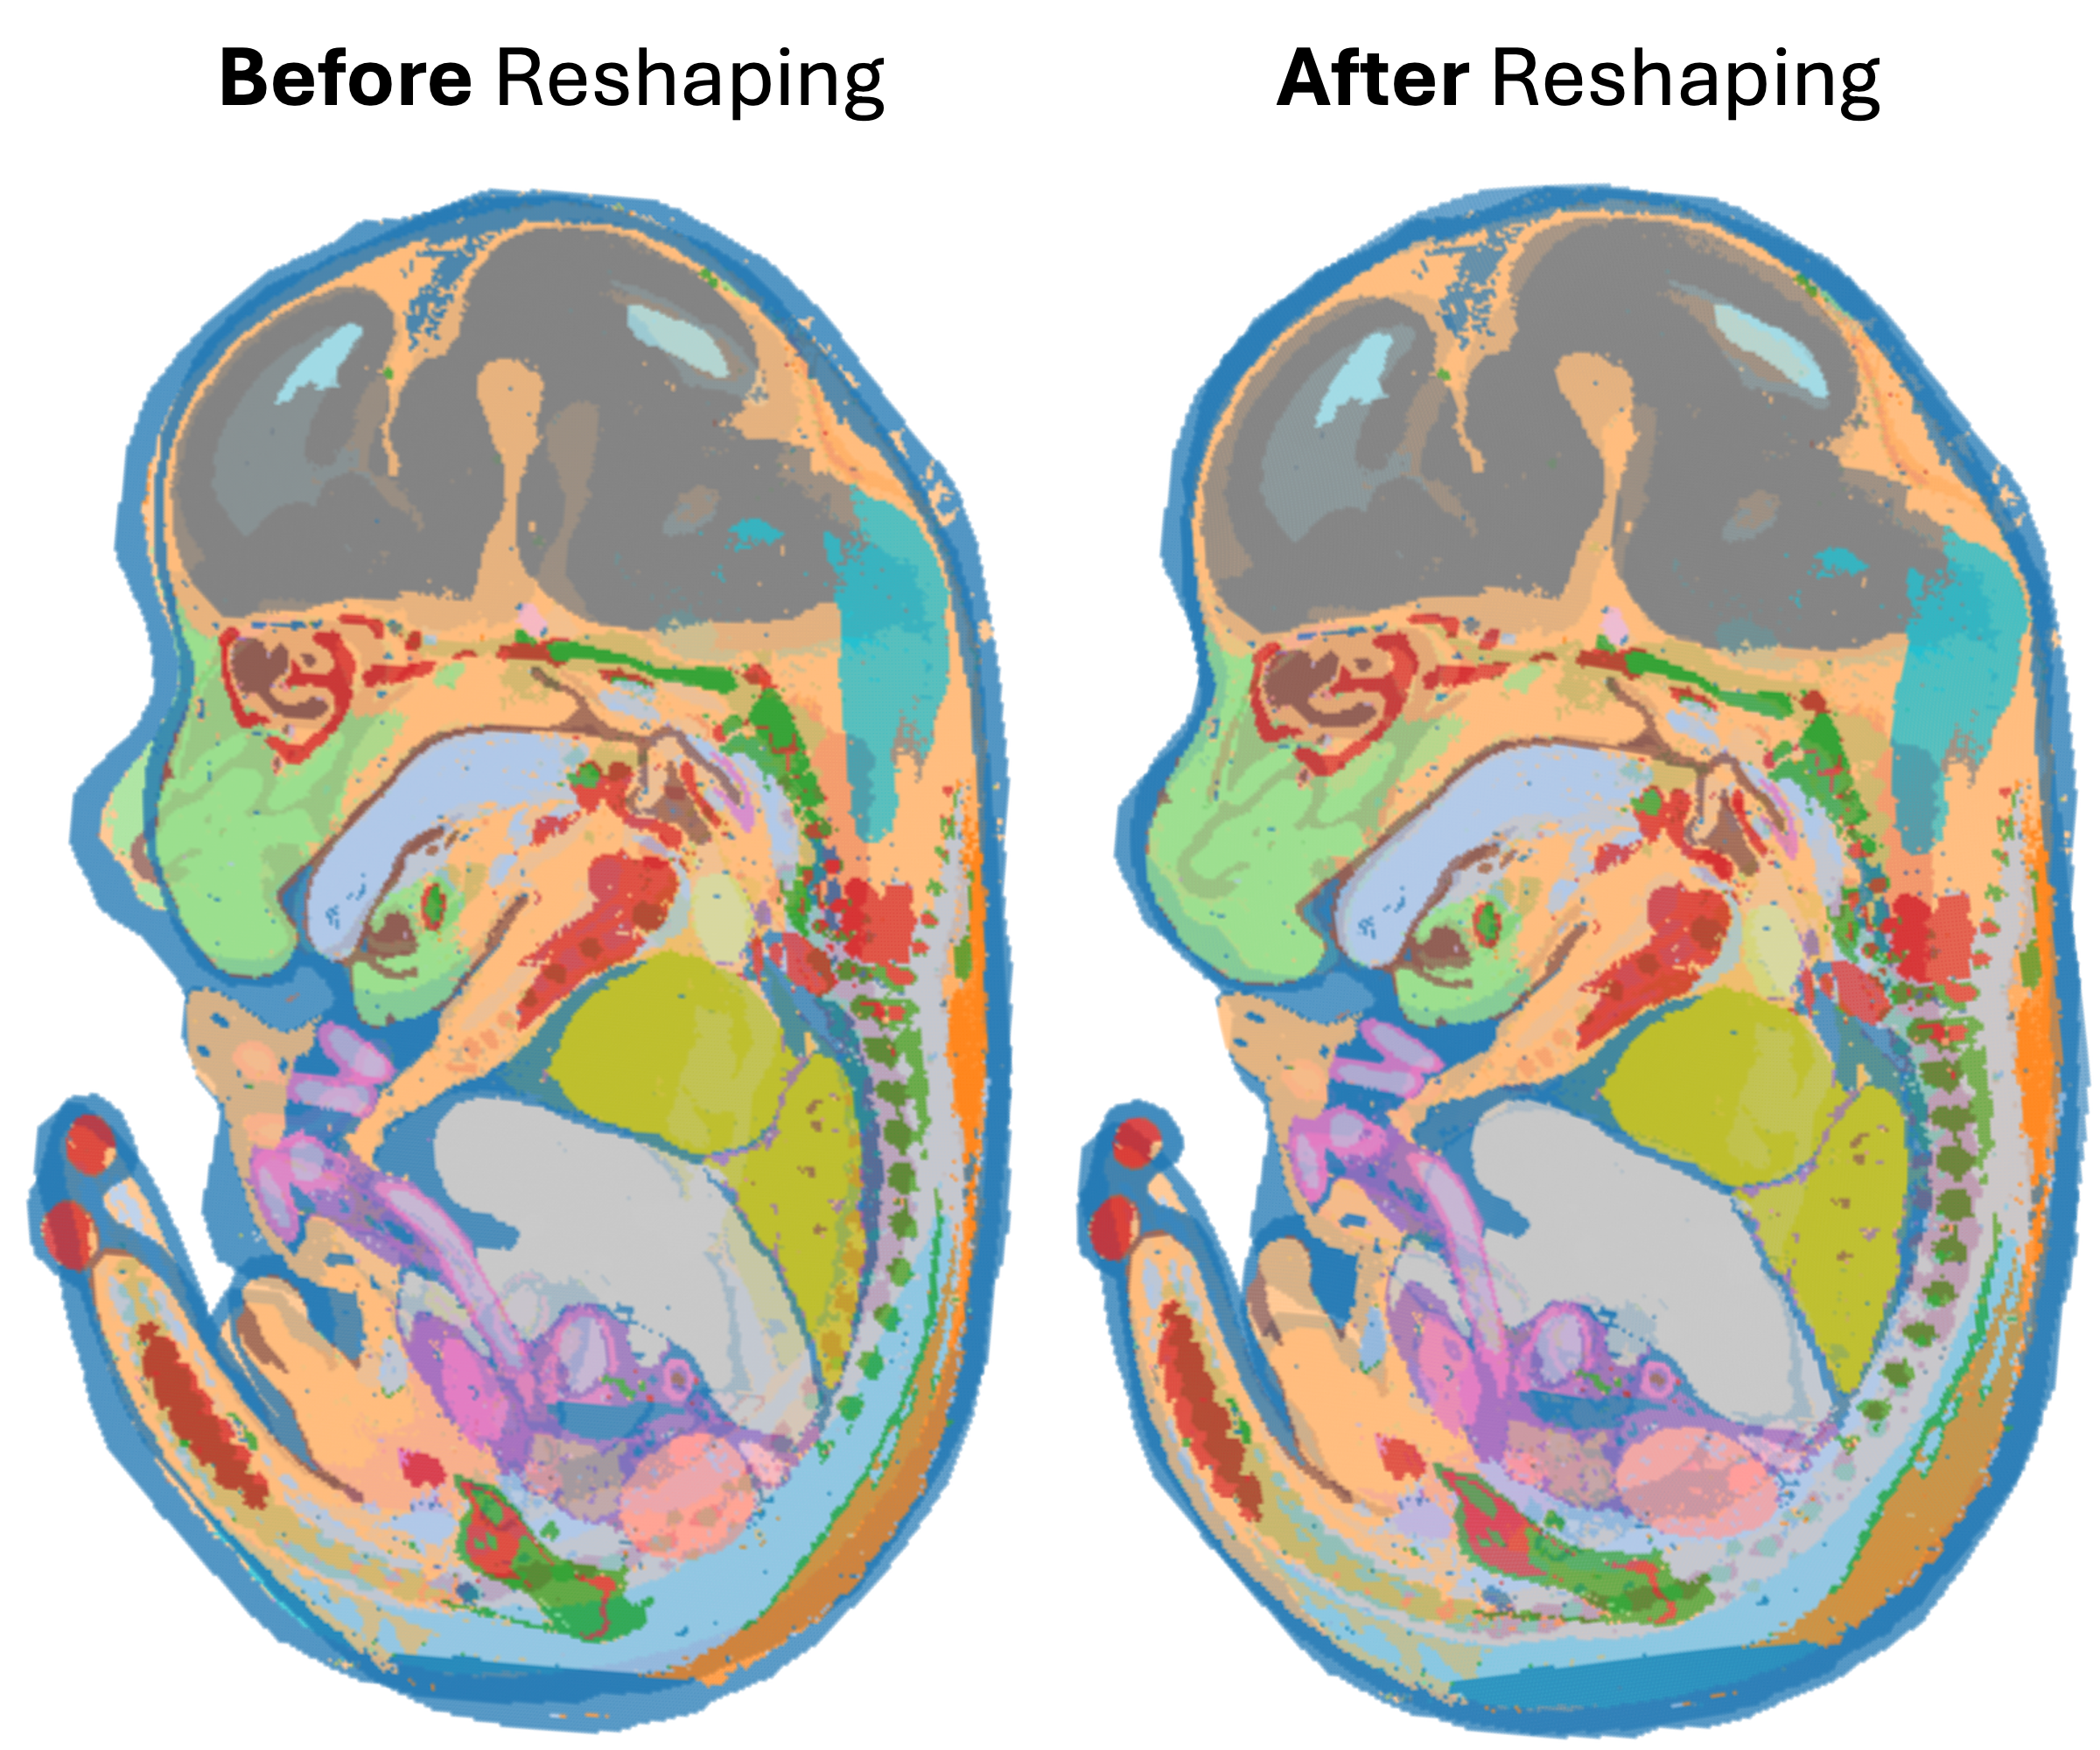
Fig: Aligning maps of the developing mouse embryo.
DET smoothly reshapes a spatial transcriptomics map to improve alignment with corresponding anatomical regions. The overlays show the maps before (left) and after (right) smooth reshaping.
Adapted from O. Hirose and E. Rodolà (2026) IEEE Trans. Pattern Anal. Mach. Intell. CC BY 4.0
KANAZAWA, Japan — Spatial transcriptomics can reveal where thousands of genes are active across a tissue, creating molecular maps at single-cell resolution. But comparing two such maps is difficult: thin slices of tissue may be rotated, stretched, or otherwise distorted, so equivalent regions do not automatically line up.
Researchers at Kanazawa University and Sapienza University of Rome have developed a computational method that aligns these maps directly from the individual measurement locations and their gene-activity values. Called Domain Elastic Transform (DET), it smoothly reshapes one digital map to match another without first converting the measurements into a regular grid of pixels.
The research, led by Osamu Hirose of Kanazawa University in collaboration with Emanuele Rodolà of Sapienza University of Rome, was published online in IEEE Transactions on Pattern Analysis and Machine Intelligence on September 15, 2026.
Why tissue maps need alignment
To understand how an organ works, scientists need to know not only which cells it contains, but also how those cells are arranged and which genes are active. Comparing tissue maps can help researchers investigate how organs develop and how disease changes the organization and activity of their cells.
Meaningful comparisons require identifying equivalent regions in different samples. For example, gene activity in one brain region should be compared with activity in the corresponding region of another brain—not an unrelated area. Yet tissue samples naturally differ in shape, and cutting and preparing thin slices can introduce stretching or other distortions. Corresponding regions therefore do not necessarily line up when their maps are placed on top of one another.
Computers can help by shifting, rotating, and, when needed, smoothly reshaping the digital maps to align corresponding regions. This process, called registration, creates a common coordinate system for comparing gene activity and cell organization across samples.
Using both tissue structure and gene activity
Finding corresponding regions requires more than matching the outlines of two tissue samples. Regions with similar shapes can have different gene-activity patterns. Each measured cell or location therefore provides two clues for alignment: where it is in the tissue and which genes are active there.
Existing methods use these clues in different ways. Image-based methods can use gene activity, but they generally first convert the measurements into a regular grid of pixels. This conversion can blur fine structures and reduce cell-level detail. Methods that align points using their locations alone keep the measurements as separate points, but may confuse regions with similar shapes. Other approaches can link cells or regions across samples without estimating how the tissue map should be smoothly reshaped.
“Spatial transcriptomics gives us two kinds of information at once: where a cell is and what genes it is expressing. We wanted an alignment method that could use both, while preserving the original spatial resolution instead of forcing the data into an image first,” says Osamu Hirose of Kanazawa University.
How DET works
For cell-level data, DET represents each cell by its position and measured gene activity.
The method repeatedly performs two steps. First, it estimates likely matches between cells in the two maps, using both their positions and similarities in gene activity. It then adjusts cell positions in one digital map, encouraging neighboring cells to move together. Repeating these steps gradually refines the alignment until it stabilizes (Fig. 1).
DET changes cell positions in the digital map, not the recorded gene-activity values. Those values instead provide clues about which regions should match. It also does not require a collection of pre-aligned training examples or manually identified matches, making the method training-free and unsupervised.
Fig. 1. How DET aligns two maps.
Alignment progresses from left to right. DET repeatedly estimates likely matches and smoothly adjusts the shape of the map being aligned. In spatial transcriptomics, each point carries gene-activity measurements; this diagram shows just one value per point to simplify the illustration.
O. Hirose and E. Rodolà (2026) IEEE Trans. Pattern Anal. Mach. Intell. CC BY 4.0
Testing DET on mouse brain data
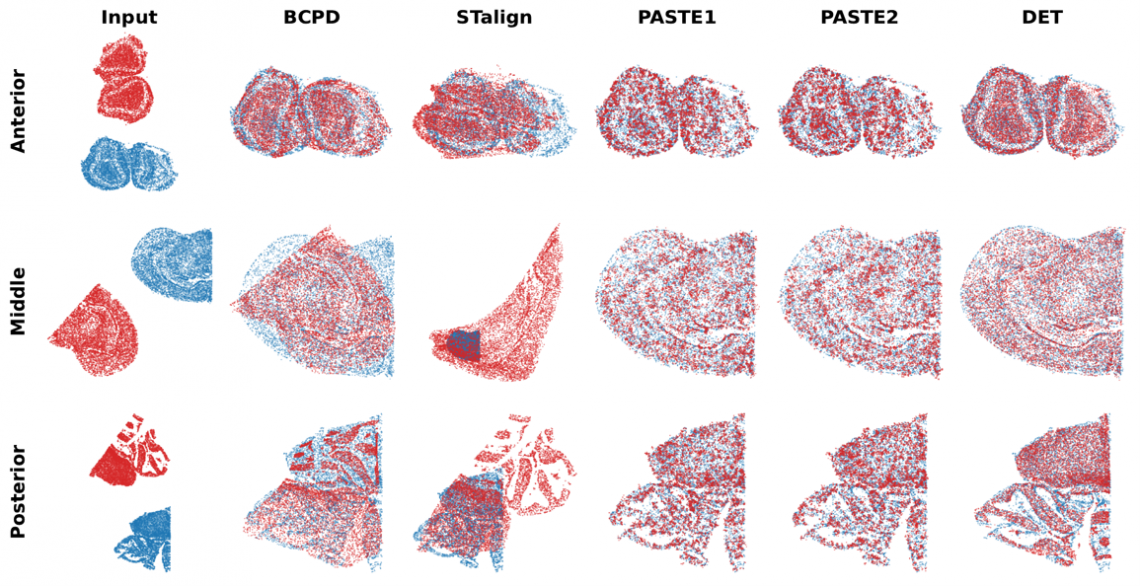
The researchers compared DET with other methods in 90 test cases using mouse brain maps created with MERFISH, a technique for mapping gene activity. To make the alignment task deliberately difficult, they digitally rotated the maps by random angles across the full 0–360° range and shifted them by large distances (Fig. 2).
Among the methods tested, DET scored highest on three measures: how well the tissue maps overlapped, whether neighboring cells remained neighbors after alignment, and how closely gene-activity patterns agreed. For the gene-activity comparison, the researchers combined gene-activity information from nearby cells before comparing the patterns.
Fig. 2. Aligning maps of mouse brain tissue.
Red and blue show the two MERFISH tissue maps being aligned; DET appears in the rightmost column. The overlaid maps show their overall position, orientation, and overlap after alignment. Separate numerical tests, rather than these images alone, assess whether neighboring cells remain neighbors and patterns of gene activity agree.
O. Hirose and E. Rodolà (2026) IEEE Trans. Pattern Anal. Mach. Intell. CC BY 4.0
Comparing maps from developing embryos
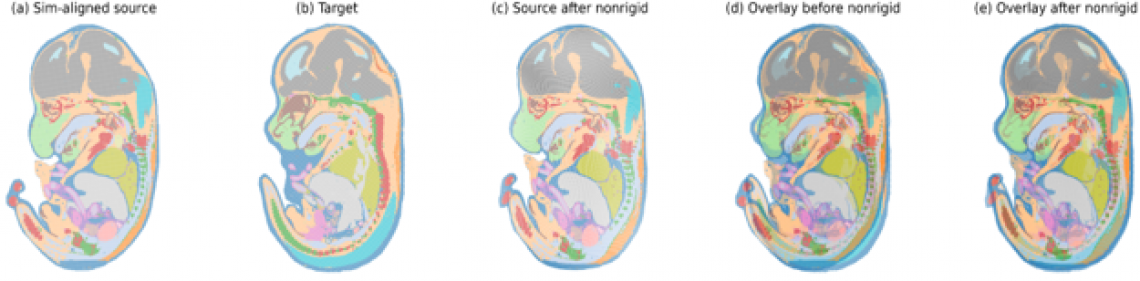
Developing embryos pose an additional challenge: their shapes change over time, along with the types and proportions of cells they contain. The researchers tested DET on mouse-embryo maps from two developmental stages one day apart. Each map contained more than 100,000 measurement locations (Fig. 3).
The maps came from the MOSTA atlas, a collection of mouse development maps, and were created using Stereo-seq, a technique that records gene activity across tissue. DET first adjusted the maps' overall position and orientation, then smoothly reshaped one to refine the alignment. No verified reference showed exactly which locations should match across these stages. The experiment therefore demonstrated that DET could be applied to maps of this size and complexity.
Fig. 3. Aligning mouse-embryo maps across development.
DET aligns maps from embryonic days 14.5 and 15.5. The source is the map being adjusted; the target is the reference map. The panels show (a) the source after its overall position and orientation are aligned, (b) the target, (c) the source after further alignment by smooth reshaping, (d) the overlay before the reshaping, and (e) the overlay after the reshaping. Colors identify anatomical regions.
O. Hirose and E. Rodolà (2026) IEEE Trans. Pattern Anal. Mach. Intell. CC BY 4.0
Working with larger datasets
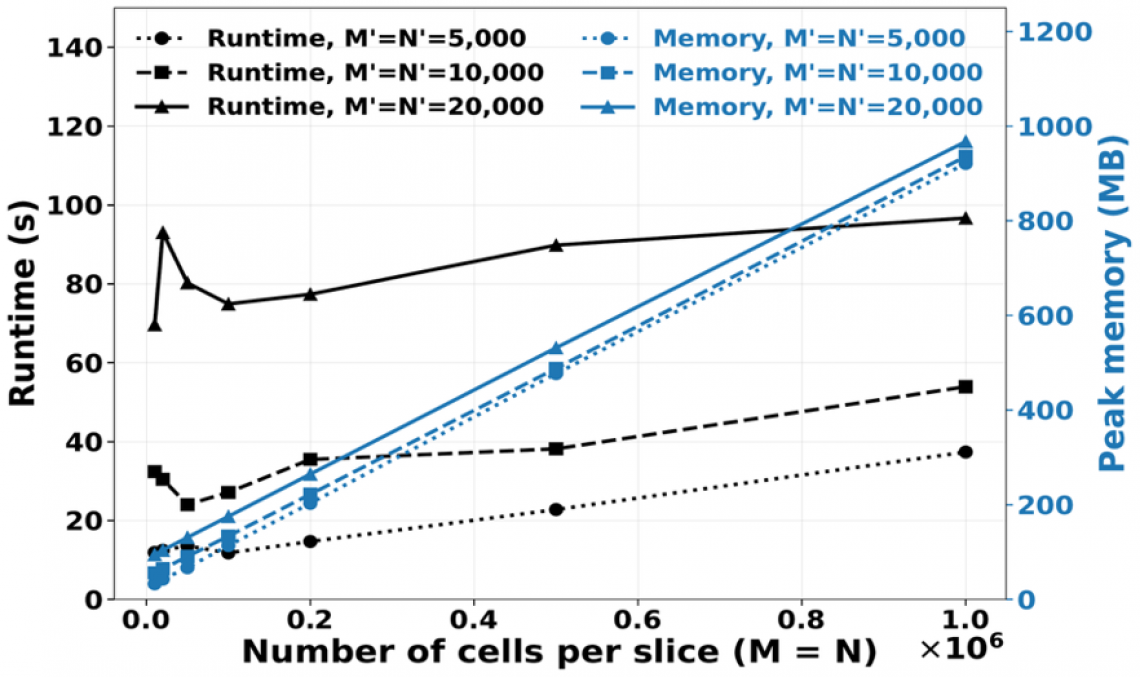
To test how DET handles larger datasets, the researchers artificially expanded MERFISH-based data to as many as one million points per tissue slice (Fig. 4). Peak memory use averaged less than 1 gigabyte (GB) in every setting tested.
DET estimates the alignment using a selected subset of points, called landmarks, and extends the estimated movement to the full map. The number of landmarks—the landmark budget—controls how much computation the reshaping step requires.
With the number of landmarks held fixed, peak memory use grew approximately in proportion to the total number of points. Computation time depended mainly on the number of landmarks used in the main alignment step, rather than the full dataset size. These results support using DET with large tissue maps, although the exact time required depends on the computer and algorithm settings.
Fig. 4. Computational scalability of DET.
Synthetic MERFISH-based stress tests increase the number of points per slice to one million. Black curves show runtime and blue curves show peak memory for three landmark budgets. Peak memory remained below 1 GB on average even at the largest tested data size.
O. Hirose and E. Rodolà (2026) IEEE Trans. Pattern Anal. Mach. Intell. CC BY 4.0
Beyond tissue maps
Tissue maps are not the only scientific data that combine locations with measurements. Similar challenges arise with measurements attached to three-dimensional surfaces or anatomical structures.
DET is intended to complement existing alignment methods, not replace them in every setting. It is designed for tasks that require both fine spatial detail and a smooth transformation of the map, rather than only a list of matching locations.
“Many scientific datasets tell us both where something is and what was measured there. We wanted a way to use both kinds of information when bringing different datasets into alignment, rather than treating shape and measurements separately,” says Hirose.
The broader aim is to help researchers compare corresponding regions across tissue samples, even when their shapes and gene-activity patterns differ.
Advertisement